Flooding
By Alex Jackson
Last updated on
Flooding occurs when a river’s discharge exceeds its channel’s volume causing the river to overflow onto the area surrounding the channel known as the floodplain. The increase in discharge can be triggered by several events. The most common cause of flooding is prolonged rainfall. If it rains for a long time, the ground will become saturated and the soil will no longer be able to store water leading to increased surface runoff. Rainwater will enter the river much faster than it would if the ground wasn’t saturated leading to higher discharge levels and floods.
As well as prolonged rainfall, brief periods of heavy rain can also lead to floods. If there’s a sudden “burst” of heavy rain, the rainwater won’t be able to infiltrate fast enough and the water will instead enter the river via surface runoff. This leads to a sudden and large increase in the river’s discharge which can result in a flash flood.
Although many floods are triggered directly by precipitation just a few hours after it falls some floods can be triggered by precipitation that fell many months ago. Precipitation that falls as snow can remain as snow on the ground until it melts. This mightn’t be until the end of winter, so potentially several months. When the snow does melt, large volumes of meltwater will enter the river increasing its discharge and triggering floods. These floods are often annual, occurring every year when snow melts in the spring. In Bangladesh, for example, melting snow in the Himalayas triggers annual floods in the summer.
Flash floods can also be triggered by slightly more catastrophic events. Erupting volcanoes can trigger very large flash floods called jökulhlaups when glaciers are partially or even fully melted by an erupting volcano or some other form of geothermal activity. The meltwater can enter rivers and greatly increase the river’s discharge leading to a flood. The eruption of Eyjafjallajökull1 in 2010 triggered jökulhlaups as the volcano had been capped by a glacier that melted when it erupted2.
Factors Affecting Flood Frequency
Physical Factors
- The size and shape of a river’s drainage basin dictates how much precipitation the river can receive and how quickly it will arrive (the lag time). A large drainage basin means that the river’s catchment area is large so it will collect a lot of water, increasing discharge. If the basin is circular in shape, the precipitation will enter the river at roughly the same time because all points in the basin are equidistant from one another. This will produce a high peak discharge and can lead to flash floods.
- The permeability of the soil and rock in a drainage basin is a big factor in flooding. If the basin’s soil is impermeable, maybe because it has been saturated by previous rainfall or has been baked by prolonged heating, then any precipitation that falls won’t infiltrate and will instead run straight into the river, increasing the river’s discharge and triggering floods. Similarly, if the rocks in the area are non-porous or impermeable (such as granite or clay) then water won’t be able to infiltrate into the rocks and will, again, run straight off into the river increasing its discharge.
- The vegetation cover in a basin will affect flooding. If a basin has very dense vegetation cover, the vegetation will intercept precipitation and store it, reducing the volume of water entering a river. Conversely, if a basin is sparsely vegetated then there will be no interception and so more water will enter a river. Vegetation helps bind soil too. With no vegetation, the soil is highly susceptible to mass wasting which can cause large volumes of soil to enter a river and reduce the river’s capacity.
- The relief and steepness of the basin affects how quickly water enters a river and so how likely a river is to flood. If the river’s valley has steep sides, water will quickly enter a river increasing the river’s discharge.
- The number of tributaries flowing into a river affects the likelihood of floods. If a river has a lot of tributaries, the river’s discharge will be much higher because lots of water will be entering it from its tributaries. After heavy precipitation, the discharge will rise even more and floods are likely, especially at confluences (where a tributary meets the river) as this is where discharge is highest.
Human Factors
- If a river’s drainage basin or floodplain has been heavily urbanised, a river becomes much more prone to flooding. Urbanisation (generally) involves the laying down of tarmac and concrete, impermeable substances that will increase surface runoff into the river and therefore increase the river’s discharge.
- Urbanisation often involves deforestation. This (obviously) reduces vegetation cover, reducing infiltration and increasing surface runoff into a river.
- To stop roads and streets from flooding, humans will often build storm drains that collect rainwater and channel it into a river or stream. Stupid/cheap humans will often send this water to the local river or stream so, although roads and streets won’t be flooded by rainwater the entire town will be as the rainwater enters the river much faster than it would without the storm drains.
Climate change is a physical factor that could, potentially, be a human factor. Changes in the climate mean that certain areas are going to experience more frequent and more intense storms that can lead to large floods. Whether this is a human factor is debatable as, while climate change is definitely happening, whether it’s the result of human activity is still uncertain. We’re probably not helping but keep in mind that the planet’s climate would be changing regardless of humanity’s existence because at this moment in time, we’re still in the tail end of an ice age.
The Effects of Flooding
Flooding can have numerous social, economic and environmental effects that can vary depending on the demographics of a population and the economic development of an area.
Social Effects
The biggest, most obvious effect is death. Floods, especially flash floods, will kill people. Flood water can travel surprisingly quickly and weighs3 a lot, so people can easily get swept away by floods. Large chunks of debris and objects like cars can easily get picked up by floodwater and can easily kill a person should they get hit by the debris. In a LEDC, you’re generally going to get much more deaths than you would in a MEDC. In a MEDC, people and governments are better prepared for floods. Rescue services can be dispatched to a flood quickly in a MEDC whereas in a LEDC, rescue teams mightn’t arrive until several hours after the flood started.
During a flood, sewage pipes are often broken and raw sewage leaks into the floodwater. This has two effects. First, it contaminates not just floodwater but drinking water too which leads to a spread of waterborne diseases such as cholera especially in LEDCs where emergency drinking water mightn’t be available. Second, the sewage gets into people’s homes which is just horrible, disgusting and incredibly difficult to clean.
In LEDCs, famines can follow floods which can lead to even more deaths. Floods will commonly inundate farmland because farmland normally develops on floodplains. If the floodwater is polluted by sewage, it will contaminate the farmland and make any food grown on it dangerous to eat. Furthermore, cattle are often killed by floods which can lead to people starving because they either don’t have a source of food or don’t have a source of income to buy food with.
Economic Effects
The big economic effect of a flood is property damage. Water can cause a lot of damage to property and when it picks up large chunks of debris such as cars, it can act like a wrecking ball, taking out chunks of buildings when cars crash into them. Very large and powerful floods can even dislodge buildings from their foundations and move them. In a MEDC, property damage is often extensive as people have lots of expensive possessions. This isn’t the case in LEDCs but that’s only because people don’t have a lot to lose in the first place. This means that the overall cost of a flood is generally substantially higher in a MEDC than in a LEDC.
Floods can cause extensive damage to infrastructure such as power lines, roads, water pipes etc. Bridges frequently collapse during a flood as they aren’t designed to withstand the high discharge of the river. The Northside Bridge in Workington, Cumbria collapsed when there were large floods in 2009. Repairing bridges and other types of infrastructure is very costly. Not only this, it can lead to a decline in the local economy as businesses are unable to operate without power or road connections. Unemployment can even increase if businesses are unable to fully recover from a flood. The economic impact of infrastructure damage and unemployment is larger in MEDCs since these countries have modern and expensive infrastructure in place. In LEDCs, this infrastructure is lacking, so there isn’t much economic damage. In fact, in a LEDC, floods can lead to positive economic effects in the long term. An influx of funding to a less developed area from charities and NGOs after a flood can result in new infrastructure being constructed that is substantially better than the previously existing infrastructure. This, in turn, creates new economic opportunities in an area by, for example, creating new trade routes.
Another economic benefit comes from when a river floods and deposits sediment across the floodplain. This improves the fertility of the floodplain and can improve agricultural yield in an area (assuming the floodwater wasn’t polluted).
Environmental Effects
Floodwater that is contaminated with sewage will pollute rivers and land when it drains back into the river. Similarly, if the river floods onto farmland, the water can be polluted by pesticides and other chemicals sprayed onto the farmland that, when drained back into the river, can pollute it and kill off wildlife that inhabits the river. If the floodwater isn’t polluted though, flooding can create wetlands that can help introduce new habitats for many species of animals.
The Recurrence Interval
The recurrence interval is a way of measuring the frequency of a flood of a specific size occurring. The accuracy of the recurrence interval is dependent on the amount of historical data available about previous floods. The recurrence interval tells you how many years you’d expect to have between a flood of a certain size. In general, a large flood has a large recurrence interval so it isn’t very frequent. A small flood will have a smaller and more frequent recurrence interval. The recurrence interval can be calculated using the following formula4:
\[ T = \frac{n+1}{m} \]
\(T\) is the recurrence interval, \(n\) is the number of years on record and \(m\) is the ranking of the flood relative to all the other floods on record for a specific river.
For example, a flood with a discharge of 200m3s-1 occurred at some point in the river’s past. Out of a data set spanning 199 years5, this flood was the 2nd largest in terms of discharge. Using the formula, this means that a flood of this size is expected to occur once every 100 years (\(\frac{199+1}{2}\)). We’d describe it as a 1 in 100 year flood.
Of course, this doesn’t mean that a flood of this size won’t occur for another 100 years. It just means that statistically it won’t. More than anything, the recurrence interval is a nice way of describing a complicated topic using simple Maths. At the end of the day though, the recurrence interval raises more questions than it answers because after a big flood all the newspapers say that it was a 1 in 300 hundred year flood and everybody feels safe that a big flood won’t affect them for another 300 years and then the river goes and floods again the next year and everybody’s all “But it wasn’t supposed to flood for another 300 years” and then somebody explains that that’s just an average and really the river can flood at anytime. People don’t like that sort of unpredictability though, so they’ll just blame the scientists/statisticians and say they got it wrong.
The point I’m trying to get at is that the recurrence interval isn’t the most useful thing in the world because it’s just an average and averages can (and often do) have anomalies. There’s nothing to stop a river having a 1 in 1000 year flood and then doing the same the next day. The other problem with the recurrence interval is that it’s based on past data. Rivers are dynamic beasts, they change and when they change, so does how they flood. While the recurrence interval’s accuracy increases as you add more data, the reliability decreases because the river’s flooding patterns will have changed over time.
Flooding in a MEDC - 2004 Boscastle Floods
On the 16th of August, 2004, the small town of Boscastle was almost completely destroyed in the space of just two hours when a 1 in 400 year flash flood occurred at around 3pm and inundated most of the town.
Location
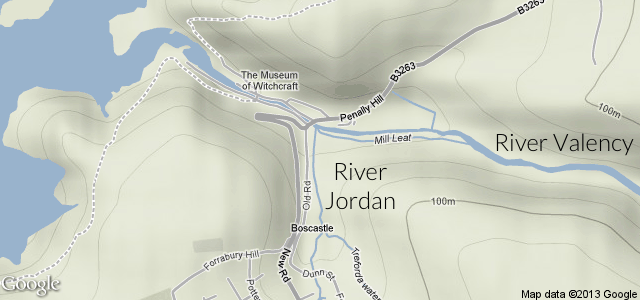
Boscastle is located in southwest England less than a kilometre from the coastline. The River Valency flows directly through the town and meets the River Jordan at a confluence in the town. The river valleys are steep and composed of shale, an impermeable rock.

The approximate location of Boscastle in the UK.
Map modified from this map by Nilfanion/Wikipedia. Licensed under the Creative Commons Attribution-Share Alike 3.0 Unported license.
.svg)
Causes
- A combination of the remnants of Hurricane Alex and convectional rainfall triggered by the intense heating of the ground by the summer heat led to heavy rainfall over the south of England. In two hours over 60mm of rain fell in Boscastle and by the end of the flood, nearly 200mm had fallen.
- The rain fell over Bodmin Moor, an area composed of impermeable shale that is has sparse vegetation cover. This increased surface runoff due to a lack of both infiltration and interception, increasing the volume of water entering the River Valency and its tributaries.
- The River Valency’s valley has a high relief and steep sides so surface runoff was increased.
- The ground had been saturated by previous rainfall6, reducing infiltration and increasing surface runoff.
- The River’s floodplain had been urbanised reducing infiltration and increasing surface runoff.
- The River Valency had a confluence with the River Jordan directly in Boscastle leading to huge volumes of water flowing through the town when both river’s discharge increased.
- As the River Valency flowed through Boscastle, its channel had been walled off preventing it from adjusting to the increased discharge and limiting its efficiency, ultimately causing it flood.
Effects
Economic
- Insurance claims came in between £15,000 and £30,000 per property. There was the potential for insurance prices to rise as a result of the flood but this was unlikely because of the rarity of a flood of this scale.
- Businesses were badly damaged with property destroyed or filled with silt, sewage and debris.
- One of the main sources of income in Boscastle was tourism. After the events of the flood, people were less willing to travel to Boscastle because of the (low) risk of another flood occurring.
- 76 cars were washed out to sea because of the low lying nature of the town’s car park.
- The “lower bridge” was badly damaged when debris blocked it and water pooled behind it. When the temporary dam finally gave, a 3m wave was released that caused even more damage to buildings downstream of the bridge.
Social
- Nobody was killed thanks to the rescue efforts but some people suffered from broken bones & hypothermia.
- Houses were flooded and silt, sewage & debris was deposited inside of them.
- Water & power supplies were taken out during the flood.
Environmental
- Raw sewage was washed out to sea and into the River Valency.
- 75 cars & 6 buildings were washed out to sea.
Short Term Responses
- A flood warning was issued for parts of Cornwall at 3:30pm but Boscastle wasn’t specifically warned.
- Just a few hours after the river flooded, a search and rescue operation was underway which lasted until 2:30am the next day. Over 150 people were saved by search and rescue operations.
- 11 Days after the flood people were allowed to return to their homes to salvage their belongings. Living in their homes wasn’t really viable at this stage.
- Prince Charles visited the town 2 days after the flood and donated a large sum of money to the town.
- A few days after the flood, geologists flew over the area to assess the risk of landslides triggered by the heavy rain.
- North Cornwall Council provided accommodation for 11 tourists who were unable to return home after the flood. The night after the disaster, 100 people used the Camelford leisure centre as a refuge.
Long Term Responses
- Reconstruction didn’t begin until 2005 as the council waited on a report from hydrologists to determine the recurrence interval of the flood.
- By early 2005, power and water was back up.
- The council invested money into improving Boscastle’s flood defences and the Environmental Agency also built new flood defences. In 2006, the channel was widened and deepened to increase its capacity and ability to handle sudden increases in discharge. In 2007, these defences were put to the test and a much smaller, more controlled flood occurred.
- The remains of the “lower bridge” that triggered a 3m wave were demolished and replaced with a larger bridge that would be more difficult to block with debris.
- The effects of the flood caused people in Boscastle to take their environmental footprint far more seriously because they were led to believe that climate change exacerbated by human activity was responsible for the “freak weather” that caused the river to flood. When buildings were reconstructed, they were done so in an environmentally friendly manner with insulation, double glazing etc. being installed in the new buildings. The town won 5 awards for its eco-friendliness.
Sources:
- Devastation in Boscastle (BBC)
- Praise and donation from their duke (The Guardian)
- Villagers clean up after flash floods (The Guardian)
- Boscastle: safe to rebuild (The Guardian)
- Boscastle reborn as a green beacon (The Guardian)
- Displaced Boscastle residents return home (The Guardian)
- ‘No deaths in Boscastle flood’ (The Guardian)
Flooding in a LEDC - 2008 Bihar Floods
During the months of August and September in 2008 there was a long period of heavy rainfall along the foothills of the Himalayas. The rainfall ultimately led to widespread floods in Bihar, an Indian state, that made millions homeless and claimed the lives of hundreds of people.
Location
Bihar is located in the north east of India, to the south of the Himalayas bordering Nepal. It is one of the poorest states in India where the caste class system, despite its lack of legality, is still in widespread use. In Bihar, 42% of the population lives below the poverty line. Through Bihar flows the Kosi River, a tributary to the Ganges.

The location of Bihar in India. Its borders are highlighted in blue.
Map modified from this map by PlaneMad/Wikipedia. Licensed under the Creative Commons Attribution-Share Alike 3.0 Unported license.
Causes
Monsoon season in India occurs in the late summer months and is caused by the seasonal reversal of winds in the area. The monsoon brought heavy rainfall to the foothills of the Himalayas and dramatically increased the discharge of the Kosi. The river was forced to flow into a channel that it hadn’t flown through in over 100 years. In doing so, it flooded a large portion of Bihar.
The flooding was worsened by the deforestation that had taken place in the Kosi River’s drainage basin. The lack of vegetation cover meant that rain water wasn’t intercepted and easily flowed into the river via surface runoff.
The Kosi River had flood defences that were supposed to handle approximately 30,000m3 of water per second7 but were breached at a fraction of that capacity suggesting that the defences were defective or poorly maintained.

A map of Bihar showing the major rivers flowing through the state. The Kosi River is highlighted in bright blue.
Map modified from this map by NordNordWest/Wikipedia. Licensed under the Creative Commons Attribution-Share Alike 3.0 German license.
Effects
Social
- The flood killed 500-2000 people. Figures vary because government figures don’t include missing people while figures from aid agencies do.
- 3 million people were made homeless and sent to refuge camps.
- A shortage of clean drinking water and the warm climate meant that water born and vector diseases were easily spread.
- Shortages of food and emergency grain quickly developed. 70% of Bihar’s population are farmers, many of which are subsistence farmers. When 100,000 Ha of land was flooded, most of their food was destroyed.
- There were allegations of discrimination when it came to evacuating people. It was claimed that the rich were evacuated first and given the most emergency food while some members of the “untouchables” (the lowest class in the caste system and Hindu society) weren’t evacuated at all.
Economic
- 70% of Bihar’s population are farmers and 100,000 Ha of land was inundated by floodwater, destroying wheat and rice that could be traded.
- Roads were destroyed, costing money to repair and disrupting trade.
- The disaster ended up costing nearly $542 million according to some reports.
Environmental
- The flood will have washed sewage and pollutants into the Kosi River, polluting it and killing off some wildlife.
Short Term Responses
- The Indian government created a £115m relief package to be sent to Bihar.
- The government released 125,000 tonnes of emergency grain that was to be distributed in Bihar. Allegations that the grain wasn’t evenly distributed arose though, with members of the lower class of Indian society being left with minimal amounts of grain while the upper classes received most of the grain.
- 400,000 people were evacuated to relief camps.
- 1,500 soldiers were sent to help rescue citizens and disperse aid. Helicopters were also provided but were limited in their effectiveness due to the continued heavy rain.
- Aid agencies were dispatched to Bihar and were especially important in ensuring that the lower classes of society were given aid. Aid agencies provided rescue efforts, food, clean water supplies and shelter.
Long Term Responses
- The World Bank gave significant funds to help Bihar recover and rebuild after the disaster. It also helped in creating plans to help improve the quality of living to standards above those seen before the disaster.
- An “Owner Driven Housing Reconstruction” scheme was created, funded by the World Bank, to give money to homeowners to rebuild their homes using bamboo, bricks, corrugated iron & concrete. Each household was given $1,200 for the reconstruction with $50 going towards a toilet and $110 towards solar powered lighting. The scheme also gave $110 to households that did not own their own land so that they could go out and buy some.
- New bridges and roads were constructed to a higher standard than those that had previously been constructed. When the plan to reconstruct infrastructure was laid out, it was expected that 90 bridges and 290km of road would be reconstructed, benefiting 2 million people.
- New flood defences were constructed and people were educated on how to maintain them. It was estimated to cost $500 million to build new embankments, strengthen existing embankments, improve flood management and improve flood prediction technologies.
For a hugely detailed list of the responses laid out by the World Bank, have a look at this PDF file. It’s long but very detailed.
Sources:
- India: Untouchables suffer ‘relief discrimination’ after flood (The Guardian)
- India: Up to 2,000 feared dead in Bihar floods (The Guardian)
- Heavy rain stalls Indian flood relief (The Guardian)
- Indian government hits back at claims of inadequate supplies in flood zones (The Guardian)
- Tensions rise over Indian flood relief (The Guardian)
- Disease outbreak feared in wake of flood (The Guardian)
- Indian monsoon floods leave a million homeless (The Guardian)
- Indian Red Cross Report
- Government of Bihar, World Bank & Global Facility for Disaster Reduction & Recovery Report
- Proposed Emergency Recovery (The World Bank)
- Interestingly, Eyjafjallajökull is the name of the glacier that capped the volcano and not the volcano itself.↩
- This type of volcanic eruption is known as a subglacial eruption.↩
- For reference, 1ℓ of (pure) water weighs 1kg.↩
- This formula is for events with a magnitude (in this case discharge). If you’re trying to measure the recurrence interval of an event that doesn’t have a magnitude (such as the recurrence interval of a flood of no specific size) use the following formula: \[T=\frac{n}{m} \] \(T\) is, again, the recurrence interval, \(n\) is the number of years on record and \(m\) is the number of times this event has occurred.↩
- Weird number, I know, I’m just trying to produce a nice round answer here.↩
- I know it was the middle of summer and it was hot but this is Britain we’re talking about.↩
- A rounded conversion from 1×106 feet3 per second.↩