Population Structure
By Alex Jackson
Last updated on
⚠️ ⚠️ ⚠️
The content on this page is extremely old. Much has changed in the world since this article was written. While many of the concepts will still be relevant, figures and case studies are likely to be outdated at this point.
Population can be measure according to:
- Age
- Gender
- Marital Status
- Language
- Religion
- Occupation
Representing Population Structure
- The age and sex structure of a population can be shown using a population pyramid.
- The age composition of different countries can be represented on a population triangle.
Stage 1 Of The DTM
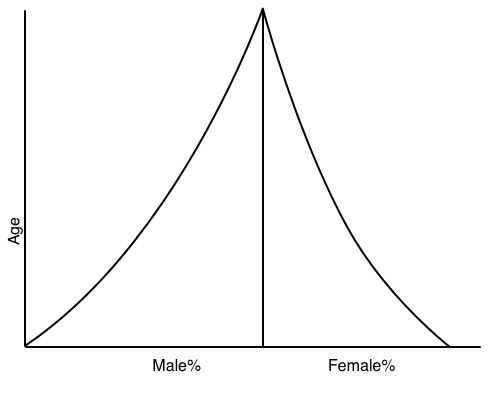
High birth rate, rapid fall in each upward age group due to high death rate resulting in a low life expectancy.
Stage 2 Of The DTM
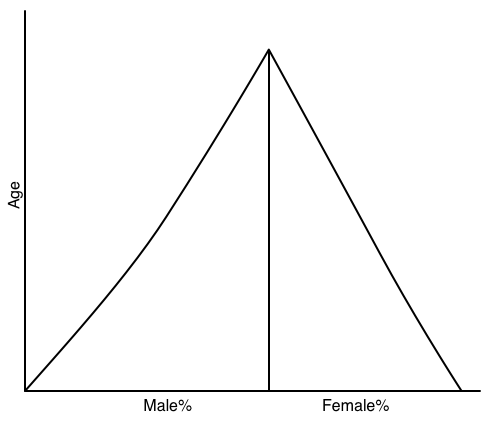
High birth rate, declining death rate, slightly longer life expectancy.
Stage 3 Of The DTM
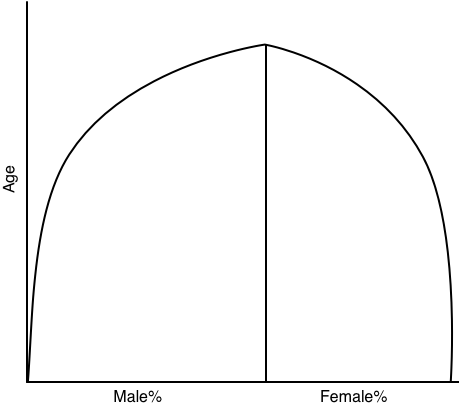
Declining birth rate, low death rate, more old people.
Stage 4 Of The DTM
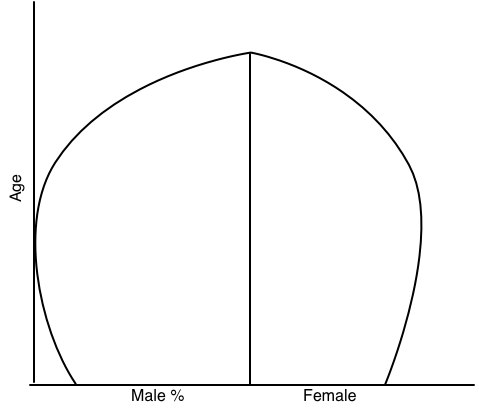
Low birth rate, low death rate, rising dependency ratio. Long life expectancy.
Migration can affect the structure of populations greatly. Internal migration within a country from rural areas to urban areas will significantly alter the number of young people aged 20-30 living in an area. In rural areas this number will decrease as young people move out of them to cities to find work. Conversely in cities the number will increase as the people from the rural areas enter the city. On a population pyramid this will result in a bulge in the population of middle aged people in cities.
Migration into a country will also alter the country’s population structure. The majority of people who migrate will be young males so this will result in an increase in the number of young males in the host country. This will also result in a decrease in the number of young males in the country of origin and, on a long time scale, the total number of males older than 18. A side effect of migration on the host country is that it will increase the number of young children too as the people who migrate into the country will be of fertile age and are likely to have children in the new country. The overall effect of this on the host country’s population pyramid is two bulges, one for young children and one for young men.
The Dependency Ratio
The dependency ratio shows how reliant young and old people are on the economically active population. A higher dependency ration indicates that more of the population is reliant on the working population. The ratio and can be expressed as follows:
Dependency Ratio = Young Population (0 - 14) + Old Population (65+) / Population Aged 15-64
The Support Ratio
The support ratio is the inverse of the dependency ratio:
Support Ratio = Population (15 - 64) / Population (65+) + Population (0 - 14)
Juvenile Index
The juvenile index indicates the proportion of young people to old people. The greater the index, the more young people there are.
Juvenile Index = Population (0 - 14) / Population (15+)
Old Age Index
The old age index indicates the proportion of old people to young people. The higher the old age ratio the greater the number of old people.
Old Age Index = Population (65+) / Population (15-64)